TrueFi ($TRU) Eyes Breakout as Altcoin Momentum Builds

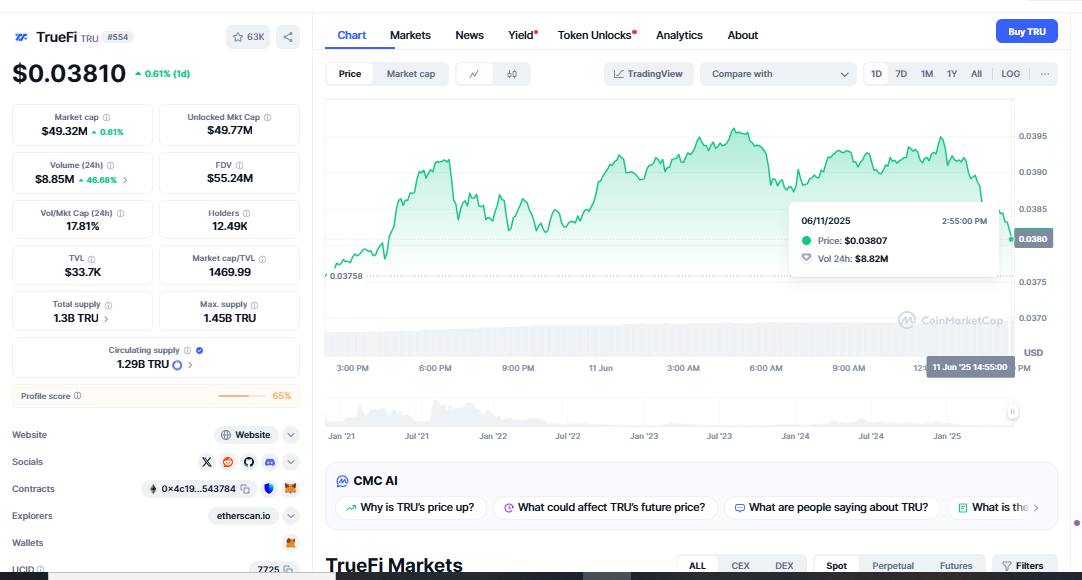
As $TRU (TrueFi) approaches a key resistance zone, TrueFi breakout, it is exhibiting strong bullish momentum. This could mean midterm gains for traders who are watching the trend. The 4-hour chart indicates that the price has broken above a descending trendline. $EGLD Breaks $15, a typical sign that the price is likely to rise in the future.
Right now, $TRU is trading just below the critical resistance level of $0.041. If the price breaks above this level, it may initiate a rally towards stronger resistance levels at $0.0474, $0.09, $0.11, and possibly even $0.14. This would mean an 80% to 100% gain from its current position if the momentum continues.
Breakout Confirmation and Price Movement
Technical indicators show that this breakout is more than just a short-term rise. The price movement on the 4H chart has not only surpassed the downward trendline, but it is also exhibiting higher volume, indicating that traders are confident in the move.

If $TRU breaks above the $0.041 resistance level, short-term traders may set their sights on the $0.0474 level, which is 25% higher than current levels. It’s vital to watch for a retest of the breakout zone, as this generally provides a good entry point before the price moves up.
Key Price Levels to Watch
-
Immediate resistance: $0.041 (key breakout zone)
-
Short-term target: $0.0474 (+25%)
-
Midterm targets: $0.09, $0.11, $0.14 (potential +80% to +100%)
The bullish setup strengthens if $TRU closes multiple candles above the breakout zone with continued high volume. Conversely, if momentum weakens or the breakout fails, traders should prepare for a possible retracement back toward support near the trendline.
Market Sentiment and Trading Strategy
TrueFi’s price change coincides with a broader rise in altcoins. This is because Ethereum has been performing better, and Bitcoin’s dominance has been declining, which has led to speculation about an “altseason.” $TRU could ride the wave if the crypto market stays positive. This is especially true because its market cap is cheap and its technical structure is flexible.
Traders and investors must effectively manage risk. Setting stop-losses below the breakout zone and adding to positions during pullbacks can help you maximize profits while minimizing risk.
Last Thoughts
$TRU is at a crucial technical juncture. The next few days could determine whether TrueFi experiences a breakout rally or has to wait for a while before it can break out. The charts are showing strong signs, and the market as a whole is in a good place. $SOLV Price Analysis, Watch for volume surges, retests, and candle closures above resistance to confirm the bullish setup. Want to be one step ahead of the next breakout? Follow us for updates on charts and information on the best altcoins.
