
Bitcoin Dominance (BTC.D) is the percentage of the total crypto market capitalisation controlled by Bitcoin, and this metric often signals major shifts in market sentiment. When BTC.D falls, institutional capital frequently rotates into altcoins, ushering in “altseason”. Bitcoin as a Strategic Asset. In mid-2025, Bitcoin’s dominance chart painted a compelling picture: bearish reversal patterns like rising wedges, double tops, and RSI divergences suggest a likely shift in momentum, with analysts predicting a powerful move into altcoins across DeFi, NFT, and Web3 infrastructure ecosystems.
Bitcoin Dominance and Altseason Dynamics
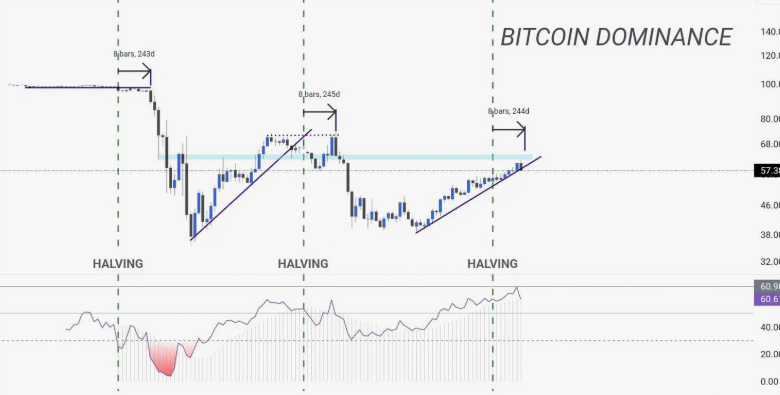
Historically, BTC.D has spent years climbing as Bitcoin leads bull cycles, especially during macroeconomic uncertainty or ETF-driven rallies. However, when BTC clinches resistance—commonly between 63–65%—and the Relative Strength Index shows bearish divergence, momentum falters. Platforms like CoinGecko and TradingView track BTC.D in real time, and mid-2025 data showed dominance stalled in a rising wedge, hinting at a reversal.
Technical analysts such as Valdrin Tahiri and Peter Brandt (via CCN and FXStreet) identified these warning signs. Tahiri noted an RSI divergence and weekly channel breakdown potential, while Brandt saw a double-top formation near 64–65%, echoing 2021’s precursors to altseason. These repeated patterns suggest a historical playbook may be replaying.
Macro Picture ETF Inflows and Market Psychology
Institutional inflows into spot Bitcoin and Ethereum ETFs supported BTC.D’s ascent, reinforcing Bitcoin’s flagship status with renewed market trust. Still, human psychology dictates capital rotation: after large BTC gains and consolidation, investors often pursue the higher beta of altcoins.
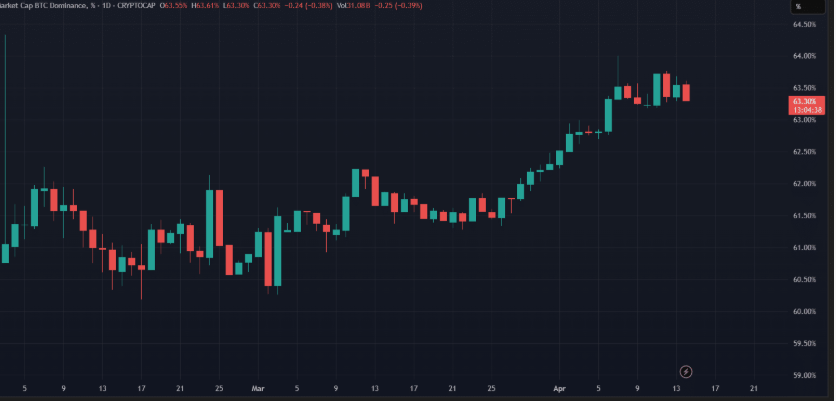
As of early June, Bitcoin hovered near a new all-time high, while dominance hovered around 63%, setting the stage for funds to flow into Ethereum, Solana, Chainlink, and other altassets. This structural shift embodies classic market rotation and momentum theory.
On-Chain Metrics Behind Dominance Shifts
On-chain data supports the chart indications. Metrics like decreasing BTC/Dominance Channel support, growing Altcoin Market Cap (ALTCAP), and elevated altcoin volumes are being tracked by platforms like Bitrue and Binance Academy.
A breakout in ALTCAP from symmetrical triangles and five-wave counts further validates rotation theory . As Bitcoin dominance dips, network activity across Ethereum’s DeFi ecosystem, Solana’s high throughput, and on-chain NFT sales supports the narrative of a true altseason.
Key Technical Patterns to Watch
Among the technical signals, several patterns stand out. Double tops and rising wedge formations on BTC.D weekly charts often prelude sharp declines. A push beneath a long-term Ichimoku Cloud support line—often between 56% and 58%—would unequivocally confirm a bearish breakout. CoinJar analysts flagged this cloud region as a critical threshold. Breaching below would signal a confirmed altseason, suggesting capital would begin flowing into altcoins en masse.
Forecasting Altseason: What Analysts Expect
Leading voices in crypto analytics predict the altcycle will hit full throttle in June 2025. João Wedson, CEO of Alphractal, posits BTC. D has already dropped from 65% to 62%, marking the early stages of altseason and strong capital flow into altcoins. Meanwhile, CCN describes both BTC.D decline and ALTCAP breakout as classic leading indicators. Technical firms like AInvest highlight RSI divergence and wedge rejections as bearish for BTC. D signals signalling altcoins are poised for explosive growth.
What Altseason Looks Like: Market Behaviour in Practice
When dominance shifts, Ethereum often leads the charge, with ETH climbing faster against BTC. Recent data shows ETH outperforming Bitcoin over 90-day trading periods, with ETH/BTC ratios making higher lows. TradingView communities like Stockmoney Lizards suggest the real altseason begins below BTC. D’s 60% support, signifying full capital rotation. Market focus moves from liquidity-laden BTC to promising Layer 1s, DeFi protocols, cross-chain infrastructure, and emerging Web3 tools.
Strategies for Trading an Altseason
Entering early after BTC.D shows a bearish breakout from the Ichimoku Cloud, with 60% support, which could yield strong returns. Traders may watch the ETH/BTC pair strength as a bellwether for capital flow. Observing fund flows into leading alts like Solana, Avalanche, and Chainlink can indicate broader movement. Equally important, monitoring volume ebbing from Rising Bitcoin Dominance into alt markets through analytics platforms enhances decision frameworks.
Seasoned voices advise taking profits if dominance rebounds or BTC begins regaining its upper trendline in dominance channels—it’s often evidence of capital rotation back to Bitcoin. High-volatility altcoins may offer extraordinary gains but demand careful risk controls, including portfolio weighting, stop-loss, and profit-taking strategies anchored in on-chain signals.
Broader Implications: Tech Innovation and Real Utility
This altcycle is distinguished from past bull runs by real-world adoption. Ethereum’s DeFi ecosystem (Uniswap, Aave, MakerDAO) is thriving, Solana supports enterprise-scale NFT gaming, Avalanche powers institutional-grade subnets for supply chains, and Layer 2 solutions address scaling bottlenecks. Bitcoin ETF, DJT Stock Surges. The maturation of smart contracts, bridge tech, oracles, tokenisation, and self-custody tools via wallets like MetaMask and Ledger adds fundamental value beyond speculation.
FAQs
Q1. What level of Bitcoin Dominance signals altseason?
Ans: A sustained fall below 60–56% on the BTC.D chart, confirmed by chart patterns and on-chain volume, typically signals an entering altseason phase.
Q2. How long does an altseason last?
Ans: Altseasons usually span several weeks to a few months, driven by macro cycles, rotation patterns, and capital allocation strategies.
Q3. Can Bitcoin and altcoins rally together?
Ans: Yes. Altseason often begins after Bitcoin has topped and consolidates; BTC can still rise modestly while altcoins outperform significantly.
Q4. Which metrics confirm rotation into altcoins?
Ans: Key indicators include BTC.D breakdowns, Ethereum’s ETH/BTC ratio strength, ALTCAP breakout, and rising altcoin volume and market cap.
Q5. Is there a way to trade altseason safely?
Ans: Combining dominance chart signals with stop-loss strategies, portfolio diversification, and technical risk management can help navigate volatility.