

The Bitcoin BTC/USD price history up to Jul 29, 2025, reveals one of the most remarkable investment stories in modern financial markets. From its humble beginnings at fractions of a cent to reaching heights of over $120,000, Bitcoin’s price journey represents more than just numbers—it showcases the evolution of digital currency acceptance worldwide. Understanding this Bitcoin BTC/USD price history up to Jul 29, 2025 provides crucial insights for investors, traders, and cryptocurrency enthusiasts seeking to comprehend market patterns and future potential. This comprehensive analysis examines every significant milestone, market cycle, and price movement that has shaped Bitcoin’s trajectory over the past decade and a half.
Genesis: Bitcoin’s Early Price Formation (2009-2012)
Bitcoin’s price story begins in 2009 when Satoshi Nakamoto launched the world’s first cryptocurrency. Initially, Bitcoin had no established market value, existing primarily as a technological experiment among cryptography enthusiasts. The first recorded Bitcoin transaction occurred in May 2010, when programmer Laszlo Hanyecz famously purchased two pizzas for 10,000 BTC, effectively valuing Bitcoin at approximately $0.0025 per coin.
The early Bitcoin BTC/USD price history reveals gradual adoption throughout 2010 and 2011. The price of Bitcoin saw its first significant increase in 2010, reaching around $0.08 in July, marking the beginning of its long journey toward mainstream recognition. By November 2010, Bitcoin achieved its first significant milestone, reaching $0.50 per coin.
The year 2011 proved pivotal for Bitcoin’s price development. The cryptocurrency experienced its first major bull run, climbing from under $1 in January to over $30 by June 2011. This 3,000% increase caught the attention of early adopters and tech-savvy investors, establishing Bitcoin as more than just an experimental digital currency. However, this early surge was followed by a significant correction, with prices falling back to around $2 by late 2011.
First Major Bull Cycle (2012-2014)
The period from 2012 to 2014 marked Bitcoin’s transition from obscurity to recognition within financial circles. During this time, the Bitcoin BTC/USD price history shows the first complete market cycle, including dramatic rises and subsequent corrections that would become characteristic of cryptocurrency markets.
In 2012, Bitcoin began recovering from its 2011 correction, steadily climbing throughout the year. The first Bitcoin halving event occurred in November 2012, reducing mining rewards from 50 BTC to 25 BTC per block. This supply reduction mechanism, built into Bitcoin’s protocol, began demonstrating its impact on price dynamics.
The year 2013 witnessed Bitcoin’s first major mainstream breakthrough. Prices surged from around $13 in January to over $1,100 by November 2013. This dramatic increase coincided with growing media coverage, increased merchant adoption, and the emergence of cryptocurrency exchanges. Significant events during this period included Cyprus banking crisis-driven demand and the launch of the first Bitcoin ATM in Vancouver.
However, the euphoria was short-lived. The collapse of Mt. Gox, once the world’s largest Bitcoin exchange, triggered a severe bear market in 2014. Bitcoin’s price fell from its 2013 highs to below $200 by early 2015, testing the resilience of early adopters and setting the stage for the next market cycle.
Maturation Phase (2015-2017)
The Bitcoin BTC/USD price history from 2015 to 2017 represents a crucial maturation phase for the cryptocurrency. Following the Mt. Gox collapse and subsequent bear market, Bitcoin spent most of 2015 consolidating between $200 and $500. This period enabled infrastructure development, discussions on regulatory clarity, and technological improvements, such as SegWit.
The recovery began in earnest during 2016, with Bitcoin’s price slowly climbing back above $400. The second Bitcoin halving, in July 2016, reduced block rewards to 12.5 BTC, further constraining the supply. Throughout 2016 and early 2017, institutional interest began to grow, with companies such as MicroStrategy and Tesla starting to explore Bitcoin as a treasury asset.
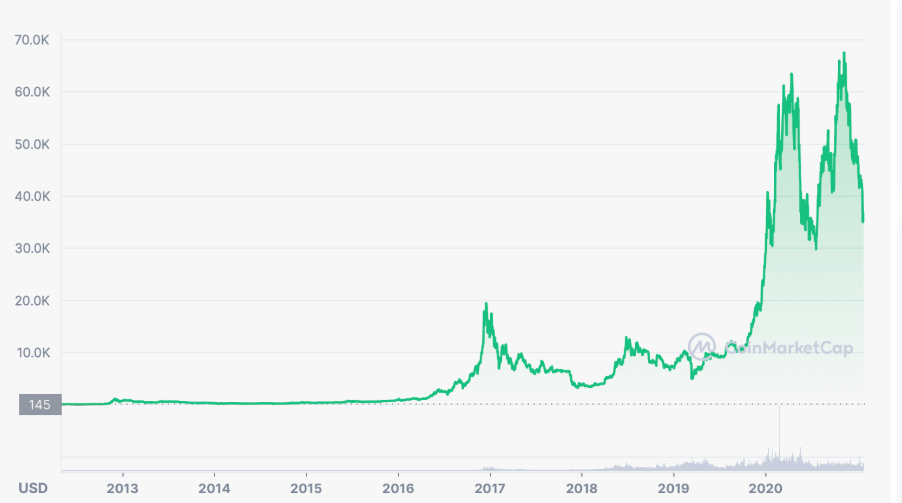
The culmination of this phase occurred in 2017, when Bitcoin experienced its most famous bull run to date. Starting the year at around $1,000, Bitcoin’s price skyrocketed throughout 2017, reaching an all-time high of nearly $20,000 in December. This surge was driven by retail FOMO (fear of missing out), the emergence of Initial Coin Offerings (ICOs), and mainstream media coverage bringing Bitcoin to households worldwide.
Cryptocurrency Winter and Recovery (2018-2020)
Following the spectacular 2017 bull run, the Bitcoin BTC/USD price history entered what many termed the “cryptocurrency winter.” Prices plummeted from their December 2017 highs, falling to around $3,200 by December 2018—a decline of over 80% from the peak.
This bear market period was characterized by regulatory uncertainty, debates over scalability, and the bursting of the ICO bubble. However, it also marked a period of significant development and institutional preparation. Major financial institutions began developing cryptocurrency services, regulatory frameworks started emerging, and technological improvements continued.
The recovery began slowly in 2019, with Bitcoin climbing back above $10,000 by mid-year before settling into a range between $7,000 and $10,000. The third Bitcoin halving occurred in May 2020, reducing block rewards to 6.25 BTC. This halving coincided with unprecedented global monetary expansion in response to the COVID-19 pandemic, setting the stage for Bitcoin’s next major rally.
Institutional Adoption Era (2021-2023)
The Bitcoin BTC/USD price history from 2021 onwards reflects the beginning of institutional adoption. Major corporations, such as Tesla, MicroStrategy, and Square, added Bitcoin to their balance sheets, while financial institutions like JPMorgan and Goldman Sachs began offering cryptocurrency services to their clients.
Bitcoin began 2021 by surpassing its 2017 all-time high and continued to climb throughout the first half of the year. The price reached new peaks of over $64,000 in April 2021, driven by institutional demand and expectations of the first Bitcoin futures ETF approval.
However, 2021 also demonstrated Bitcoin’s continued volatility. Regulatory concerns in China, environmental criticism regarding Bitcoin mining, and profit-taking led to significant price corrections. The year concluded with Bitcoin trading around $47,000, still representing substantial gains from the previous year.
The year 2022 proved challenging for Bitcoin and the broader cryptocurrency market. Rising interest rates, concerns about inflation, and the collapse of major cryptocurrency platforms, such as FTX, created sustained selling pressure. Bitcoin’s price fell to around $15,500 by late 2022, marking one of its most severe bear markets.
Bitcoin BTC/USD Price History: Recent Developments (2024-2025)
The most recent chapter in Bitcoin’s BTC/USD price history, up to July 29, 2025, has been marked by unprecedented institutional acceptance and regulatory clarity. Bitcoin reached a new all-time high price of $73,737.94 on March 14, 2024, driven by substantial inflows into newly approved spot Bitcoin ETFs and increasing institutional adoption.
The approval of spot Bitcoin ETFs in January 2024 represented a watershed moment for cryptocurrency adoption. Bitcoin ETFs then began trading on Jan. 11, 2024, providing traditional investors with regulated exposure to Bitcoin through familiar investment vehicles.
Recent data shows remarkable price performance throughout 2025. July 2025 Stats – Open: 107199.3464, Close: 120004.4489, High: 120004.4489, Low: 105724.3358, indicating Bitcoin has sustained levels above $100,000 for extended periods. This price stability at high levels suggests growing market maturity and institutional confidence.
Corporate adoption has accelerated significantly. Strategy raised $2.52 billion by selling 28 million shares of its preferred stock, planning to buy over 20,500 BTC at an average price of $120,000, demonstrating continued institutional demand even at elevated price levels.
Major Price Milestones and Historical Significance
Throughout its Bitcoin BTC/USD price history up to Jul 29, 2025, several key milestones have defined Bitcoin’s journey:
- First Dollar Parity (2011): Bitcoin reaching $1 marked its transition from experimental technology to legitimate digital asset. This milestone validated the concept of decentralized digital money and attracted early investors and developers.
- Mt. Gox Peak and Collapse (2013-2014): The rise to over $1,100 and subsequent crash demonstrated both Bitcoin’s potential and the risks associated with centralized exchange infrastructure. This period led to improved security practices and regulatory awareness.
- Mainstream Recognition (2017): The surge to nearly $20,000 brought Bitcoin into mainstream consciousness. This bull run introduced millions of retail investors to cryptocurrency and sparked global discussions about digital money’s future.
- Institutional Validation (2020-2021): The corporate treasury adoption and involvement of financial institutions legitimized Bitcoin as a store of value. This period marked Bitcoin’s evolution from speculative asset to institutional portfolio component.
- ETF Approval and Regulatory Clarity (2024-2025): The approval of spot Bitcoin ETFs and sustained prices above $100,000 represent Bitcoin’s maturation into a recognized financial asset class with growing regulatory acceptance.
Factors Influencing Bitcoin Price Movements
The Bitcoin BTC/USD price history reveals several recurring factors that influence price movements:
- Supply Dynamics: Bitcoin’s fixed supply cap of 21 million coins creates scarcity that supports long-term price appreciation. The halving events, which occur every four years, reduce new supply creation, historically preceding major bull markets.
- Regulatory Developments: Government actions have a significant impact on Bitcoin prices. Positive regulatory developments, like ETF approvals, drive prices higher, while restrictions or bans cause immediate selling pressure.
- Institutional Adoption: Corporate treasury purchases and involvement from financial institutions provide substantial buying pressure and price stability. These large-scale acquisitions often trigger sustained price increases.
- Macroeconomic Factors: Global economic conditions, inflation rates, and monetary policy decisions influence Bitcoin demand. During periods of currency debasement or financial uncertainty, Bitcoin often benefits as a hedge asset.
- Technological Improvements: Network upgrades, scaling solutions, and security enhancements impact investor confidence and perceptions of long-term viability, affecting price trends.
- Market Sentiment: Social media, media coverage, and investor psychology create momentum that amplifies price movements in both directions. Fear and greed cycles remain prominent features of Bitcoin markets.
Comparative Analysis: Bitcoin vs Traditional Assets
When examining Bitcoin BTC/USD price history up to Jul 29, 2025 against traditional assets, several patterns emerge. Bitcoin’s volatility significantly exceeds that of stocks, bonds, or commodities, but superior long-term returns for early adopters have accompanied this volatility.
The correlation between Bitcoin and traditional markets has evolved. Initially, Bitcoin moved independently of stock markets; however, increasing institutional adoption has led to periods of higher correlation, particularly during major market stress events.
Bitcoin’s performance during periods of inflation has been mixed. While positioned as “digital gold,” Bitcoin’s reaction to inflation has been inconsistent, sometimes acting as an inflation hedge and at other times declining alongside growth assets during periods of monetary tightening.
The 24/7 nature of Bitcoin markets contrasts with the limited trading hours of traditional markets. This continuous trading creates unique price dynamics, allowing for rapid responses to global events, regardless of geographic location or time zone.
Technical Analysis and Chart Patterns
The Bitcoin BTC/USD price history demonstrates several recurring technical patterns that traders and analysts monitor:
- Long-term Uptrends: Despite significant volatility, Bitcoin has maintained a long-term upward trajectory since inception. Major support levels have generally held during corrections, providing buying opportunities for long-term investors.
- Cyclical Patterns: Four-year cycles corresponding to halving events have created predictable patterns of bull and bear markets. These cycles typically feature 12-to 18-month bull runs followed by 2- to 3-year consolidation or bear market periods.
- Support and Resistance Levels: Psychological price levels, such as $10,000, $50,000, and $100,000, have acted as significant support and resistance points throughout Bitcoin’s history. Breaking these levels often signals considerable trend changes.
- Volume Analysis: Trading volume patterns offer insights into the sustainability of price movement. High-volume breakouts typically lead to sustained price movements, while low-volume rallies often reverse quickly.
- Momentum Indicators: Technical indicators such as RSI, MACD, and moving averages have proven effective for identifying overbought and oversold conditions in Bitcoin markets; however, traditional timeframes may require adjustment to account for cryptocurrency volatility.
Global Adoption and Market Impact
The Bitcoin BTC/USD price history reflects growing global adoption across multiple sectors:

- Payment Systems: Major payment processors now support Bitcoin transactions, increasing its utility as a medium of exchange. This practical usage provides fundamental value beyond speculative demand.
- Cross-border Remittances: Bitcoin’s borderless nature makes it attractive for international money transfers, particularly in regions with limited banking infrastructure or unstable local currencies.
- Store of Value: In countries experiencing hyperinflation or currency devaluation, Bitcoin has emerged as a preferred store of value, driving regional demand and price support.
- Financial Inclusion: Bitcoin provides financial services access to unbanked populations worldwide, creating new markets and user bases that support long-term price growth.
- Institutional Infrastructure: The development of custody solutions, trading platforms, and regulatory frameworks has made Bitcoin accessible to institutional investors, dramatically expanding the potential investor base.
Risk Factors and Market Considerations
Despite its impressive price history, Bitcoin faces several ongoing risks:
Regulatory Uncertainty: Government actions remain the primary risk factor for Bitcoin prices. Adverse regulatory developments in major markets could significantly impact demand and price levels.
- Technology Risks: Although Bitcoin’s network has operated continuously since 2009, potential technical vulnerabilities or scaling limitations could impact its long-term viability and price performance.
- Competition: The emergence of central bank digital currencies (CBDCs) and competing cryptocurrencies could reduce Bitcoin’s market share and price premium.
- Environmental Concerns: Bitcoin mining’s energy consumption continues to generate criticism and regulatory scrutiny, potentially limiting institutional adoption in environmentally conscious markets.
- Market Manipulation: Bitcoin markets remain susceptible to manipulation by large holders (“whales”) due to relatively low liquidity compared to traditional financial markets.
- Custody Risks: Security breaches, lost private keys, and exchange failures continue posing risks to Bitcoin holders, potentially affecting market confidence and prices.
Future Price Projections and Market Outlook
Based on the Bitcoin BTC/USD price history up to Jul 29, 2025, several trends suggest continued long-term price appreciation:
- Institutional Adoption Momentum: Growing corporate and institutional adoption provides sustained buying pressure and price support. As more institutions allocate to Bitcoin, demand is expected to continue increasing.
- Supply Scarcity: With over 19 million of 21 million total Bitcoins already mined, increasing scarcity should support higher prices over time. Future halving events will further reduce the creation of new supply.
- Global Monetary Expansion: Continued fiat currency debasement and monetary expansion worldwide support Bitcoin’s value proposition as a scarce digital asset and inflation hedge.
- Infrastructure Development: Enhancing custody solutions, trading platforms, and regulatory frameworks makes Bitcoin more accessible to mainstream investors, thereby expanding the potential market.
- Generational Wealth Transfer: Younger generations’ comfort with digital assets suggests continued adoption as they inherit wealth and make investment decisions.
However, several factors could limit future price appreciation:
- Market Maturation: As Bitcoin markets mature, volatility may decrease, potentially reducing dramatic price increases while providing greater stability.
- Regulatory Restrictions: Adverse regulatory developments in major markets could limit institutional adoption and price growth.
- Competition: Emerging technologies or cryptocurrencies could challenge Bitcoin’s dominant position, affecting its price premium.
- Economic Stability: Improved global economic conditions might reduce demand for alternative assets like Bitcoin, limiting price growth.
Conclusion
The Bitcoin BTC/USD price history up to Jul 29, 2025 tells a remarkable story of innovation, adoption, and market evolution. From its origins as an experimental digital currency to its current status as a recognized financial asset trading above $100,000, Bitcoin has demonstrated unprecedented growth while establishing new paradigms for digital money.
This comprehensive analysis of Bitcoin BTC/USD price history up to Jul 29, 2025 reveals consistent patterns of adoption-driven growth, regulatory impacts, and technological advancement. The journey from fractions of a cent to six-figure valuations reflects not just speculative enthusiasm but fundamental shifts in how society views money, value storage, and financial sovereignty.
For investors and enthusiasts seeking to understand cryptocurrency markets, studying this Bitcoin BTC/USD price history up to Jul 29, 2025 provides essential insights into market cycles, adoption patterns, and the factors driving long-term value creation. As Bitcoin continues to evolve and mature, its price history serves as both a record of past achievements and a foundation for future projections.
FAQs
Q: What was Bitcoin’s highest price in the BTC/USD price history up to Jul 29, 2025?
A: Based on recent data, Bitcoin reached its highest recorded price of approximately $120,004 in July 2025, representing a significant milestone in its price history and demonstrating continued institutional demand and market maturity.
Q: How has Bitcoin’s price volatility changed throughout its history to Jul 29, 2025?
A: Bitcoin’s volatility has generally decreased over time as the market has matured and institutional participation has increased. While still more volatile than traditional assets, the price swings have become less extreme compared to early years, with institutional adoption providing greater price stability.
Q: What major events have most significantly impacted Bitcoin BTC/USD price history?
A: Key events include the Mt. Gox collapse (2014), the 2017 mainstream adoption surge, corporate treasury purchases beginning in 2020, and the approval of spot Bitcoin ETFs in 2024, each creating lasting impacts on price trends and market structure.
Q: How do Bitcoin halving events affect the BTC/USD price history?
A: Bitcoin halving events, occurring approximately every four years, have historically preceded major bull markets by reducing new supply creation. The pattern shows significant price appreciation typically beginning 6-18 months after each halving event.
Q: What role does institutional adoption play in Bitcoin’s price history up to Jul 29, 2025?
A: Institutional adoption has been the primary driver of Bitcoin’s price stability and growth in recent years, providing sustained buying pressure, reducing volatility, and validating Bitcoin as a legitimate asset class for mainstream investors.