
Bitcoin has been rising since the middle of April, surpassing significant resistance levels and reaching a high of $111,963. However, the market’s current behavior suggests that the increase may be stopped. Bitcoin price analysis sells near $107,700, representing a meager daily chart decline of 0.05%. This price decline seems to be a regular regression rather than a breakdown since several technical indicators reveal that the price is losing its increasing momentum.
Technical Bitcoin Change in Momentum Signal Signs
Bitcoin just touched the top band if you set the Bollinger Bands to the conventional 20-day duration with a 2-standard deviation. This link usually indicates too much extension and a greater likelihood of a pullback. The price is almost $107,738, headed toward the 20-day moving average. One could consider this to be the first degree of support. Should Bitcoin remain above this threshold, Bitcoin ETF Inflows, it could simply be a minor adjustment in a clear trend.
Looking at the MACD, Bitcoin is still in a good position, but the histogram’s bars are getting shorter, which means progress is lessening. Should selling pressure increase, a probable bearish crossing can cause a temporary shift in trend. Momentum indicators like the MACD sometimes signal changes in the trend before the prices show them, so traders should be cautious.
Another crucial tool for understanding current market attitudes is the relative strength index (RSI). Right now it is 63.87, much over the neutral 50 mark, but gradually descending into the overbought zone—less pressure to buy now results from this as well. The RSI remains above significant levels; hence, a negative trend has not yet begun. It implies that rather than there being a tremendous push to sell, things are calming down.
Support and resistance define the range of BTC trading.
According to the price structure, the area between $105,000 and $106,000 has been somewhat supportive. Bitcoin will have to keep this area under control to maintain its medium-term optimistic structure. Should the market drop below this level, it may enter a deeper consolidation phase and explore psychological levels closer to $100,000.
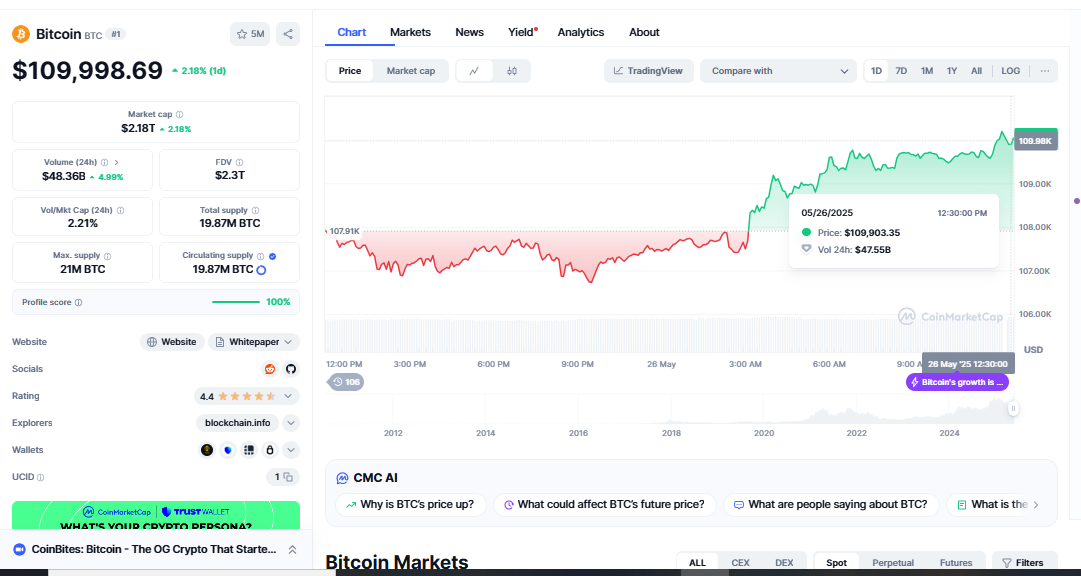
The primary obstacle on the upward side is the former high mark, $111,963. Should BTC break and close above this level, consumers could begin buying once more, driving the price to fresh all-time highs. As BTC keeps setting new lows, traders will closely observe how it reacts to this upper limit.
Fundamentals and ETF demand help to foster a positive view.
Apart from the technical projections, the macro and basic background support a long-term positive inclination for Bitcoin. The popularity of Bitcoin ETFs has generated a lot of commercial demand, which is mostly responsible for the asset’s recent value increase. These ETFs are not only gaining popularity; they are also constantly setting fresh inflow records.
This demonstrates the uncertainty among institutional investors about whether Bitcoin will be a long-term asset. Since more individuals use Bitcoin and the rules in some markets are clearer, it is also becoming a better hedge tool. Even with temporary technical declines, this higher acceptance gives prices a strong basis of support.
Consolidation might help to arrange the next leg up.
Although the price of Bitcoin is displaying some temporary resistance and seems to be losing pace, generally, the trend is still upward. Following a large increase, the pullback looks typical. It allows the market to recover before trying to climb once more. The movement will remain as long as the price stays above important support levels and technical indicators offer weak signals of a turnaround.
Investors should be ready for the price to remain the same over the next several days as BTC aggregates its most recent increases. This kind of pricing behavior can be favorable if it lets prices grow and generates a fresh foundation of support before the next attempt to break out. Momentum fluctuates rapidly, so traders and long-term holders must be conscious and modify their plans as necessary.
Take charge of your Bitcoin strategy.
Review your Bitcoin trade strategy once more now. Understanding Bitcoin’s current operations is crucial, whether you are seeking short-term opportunities or long-term holdings. This cooling-off phase could be a fantastic chance to buy more before the next significant movement, Bitcoin Price Analysis, as the demand for ETFs rises and the larger narrative points toward crypto. Watch the zones of support and opposition; avoid letting temporary noise distract you from the overall picture. For investors and traders, Bitcoin is still a great asset in today’s fast-evolving digital economy.