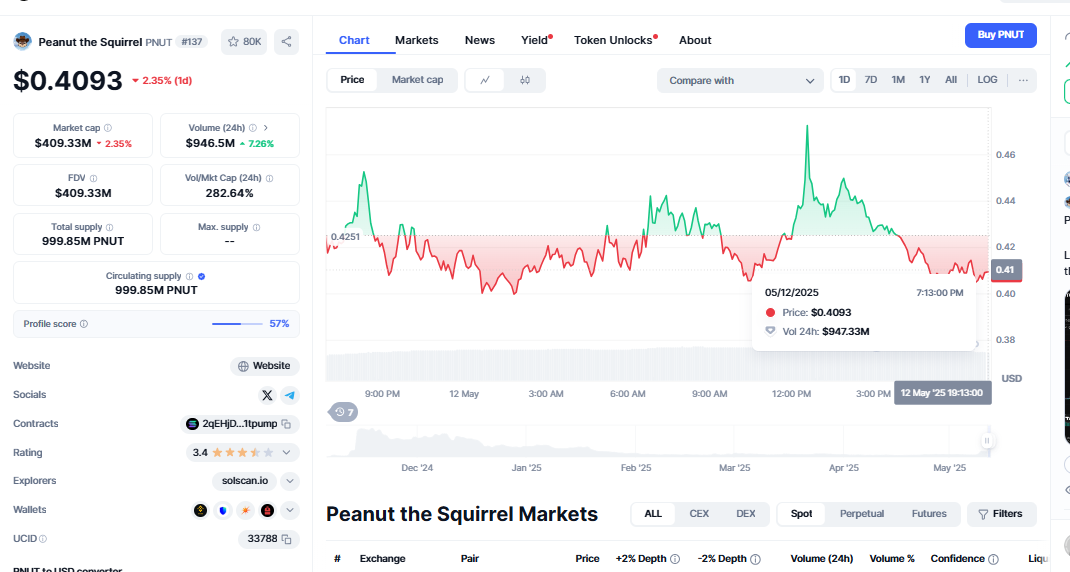
$PNUT/USDT 4H Chart, Bearish Pullback Nears Key Support

The cryptocurrency market is still quite erratic, so $PNUT is no different. On the 4-hour chart from BingX, the pair of $PNUT/USDT lately peaked around $0.00721 in the region. It then dropped to $0.00715. Though just a 1.43% decline, the pattern points to something more significant. The asset’s 50-period and 200-period Exponential Moving Averages (EMAs) have lately dropped below. These are substantial technical indicators that are usually used to determine the intensity and direction of a trend. $PNUT/USDT 4H Chart. Since the price crossed below both EMAs, indicating a likely bearish retracement, traders are paying great attention to what comes next.
Price adjustments might cause a breakdown.
The price has dropped below significant moving averages, indicating a negative short-term picture. Traders usually interpret a break below these EMAs as a signal to sell, especially if volume increases on the downslope. Regarding $PNUT, the volume did rise during the decline, indicating the actual selling impetus behind this action. Traders will thus closely observe how $PNUT responds to its next support level.
Right now, support comes around at $0.00702. This is because, should $PNUT fail to hold here, the next most likely aim would fall in the $0.00650 level. Dogecoin Surges 18%, Such an action could cause individuals to become more negative, which would cause short sellers to seize the opportunity to profit. Conversely, if the asset can steady and rebound off this support, $0.00721—the previous local high—will be the next crucial level of resistance to test. This degree of opposition is not only for show; it also indicates whether bulls can reverse the current trend.
Indicators Point to Potential Turnaround
Not all indicators point downhill, even though that is the present direction. A key indicator is the Relative Strength Index (RSI), which the 4-hour chart shows is now somewhat near 40. A momentum predictor, the RSI gauges the rate and degree of price movement. Usually, a rating below 30 indicates that the market is oversold; a score above 70 indicates that the market is overbought. The RSI is near 40; hence, $PNUT is approaching an oversold region. This would suggest that a relief bounce is just around the corner. Still, caution remains the primary emotion until that bounce shows through.
If momentum traders spot other indicators indicating this RSI number is accurate, such as bullish candlestick patterns or a change in volume from selling to buying, they may favor this RSI figure. The RSI indicates that the stock has bearish pressure, but it is not too distant from a likely turning point.
Prepare for a trade: either a rebound or more breakdown?
Depending on how the market behaves in the next several hours or days, a trade possibility in this price range might go either way. Should $PNUT maintain its footing at $0.00702, there is a significant probability it will bounce back to test resistance at $0.00721. Should the retest go smoothly and the breakout occur, the short-term perspective might shift to optimism, therefore attracting buyers who have been waiting.

However, should $PNuts drop below the support level of $0.00702 and have a lot of volume, the price may drop considerably further. The next target would be about $0.00650; hence, a move to that level could cause anxiety among holders awaiting a breakout to the upside. Much will rely on the state of the market, particularly in view of larger crypto market trends and the performance of altcoins.
Consequences for PNUT merchants more generally
Even now, the larger picture of $PNUT is still crucial, even after the technical research. Being a lesser-known altcoin, its value typically depends on the direction of Bitcoin, public opinion of it on social media, and market liquidity. Low trade volume compared to large-cap coins might also result in more forceful movements like the one in progress. This emphasizes the zones of support and opposition even more.
You should also consider how the BingX platform could alter trading exposure and behavior. The price can become more erratic as more traders join and more people discover $PNUT via extensive chart updates. Expert levels are thus more responsive, and momentum changes occur faster. $PNUT/USDT 4H Chart, Those who trade $PNUT should be cautious, apply stop-loss techniques, and monitor the market using the most recent charts.
Last Notes: $PNUT Is Crucially Point
Confirmed when it dropped below both the 50 and 200 EMAs, $PNUT is currently showing a bearish pullback on the 4-hour chart. Still, $0.00702 is the line in the sand providing support. Should it remain in situ, a rebound to $0.00721 may occur. If not, the $0.00650 range is probably under inspection. Though it hasn’t happened yet, the RSI indicates that a bounce could be coming.
Traders should be extremely vigilant. Watch the RSI and volume behavior, among other important indicators. This could be a crucial period, XRP Price Prediction, whether you trade once a week or daily. $PNUT/USDT 4H Chart, Keep involved, attentively consider things, and be ready to act. What $PNUT does next might define its short-term path.
